stats.js
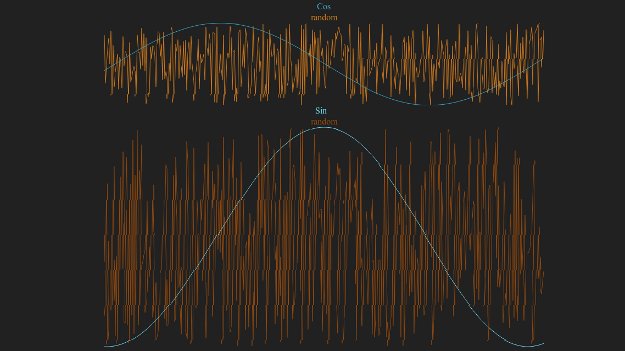
Tue 15 February 2011 ?? CommentsI have written this afternoon a little class to manage graph, for osg.js I will need to graph the update/cull/draw traversal and I guess more others things, so I needed a stats functionnality a bit like in Three.js demo. I have first get his stats.js, but it did not fit my use and I wanted to try without redrawing the full graph. I want to get the previous result of the canvas then shift it by a delta (new_time - previous_time) and draw only one line for the delta elapsed. I have not check if it produces better performance but it was cool to code it. You can see the result here and the source code is on github. The only problem I could see is that the line are not as clean as it could because they are not connect from a full path, and the consequence is that antialias can't work on the full path.
